Icon décoration

PaleoScan™ High-Resolution Seismic Interpretation Workflow for 3D Seismic Data in Volcanic System

PaleoScan™ High-Resolution Seismic Interpretation Workflow for 3D Seismic Data in Volcanic System


In the past few years, volcanic reservoirs have received more attention not only in petroleum exploration and production but also in carbon sequestration worldwide. However, it remains a real challenge for traditional seismic interpretation methods (i.e manually-picking, seed-based auto-tracking methods) in delineating sedimentary and volcanic features, where sediments are often altered and compartmentalized by dyke and sill networks of the volcanic system. Hereby using PaleoScan software, we developed an innovative workflow for better extracting 3D architectural elements, building the geological history with their associated geological processes of the complex buried Kora volcanic system in the Taranaki Basin, New Zealand.

In the first step, using PaleoScan™ Color Blending viewer and its cross plot (figure 1), the volcano geobody can be extracted interactively with great details. The geobody can be used for the Model Grid creation step (figure 2), which is the core engine in PaleoScan™, and also for further geomodeling purposes (see also PaleoScan™ Blending Viewers).

Figure 1: Example of PaleoScan™ Color Blending viewer, where 2 seismic attribute volumes are assigned to 2 channels and a controllable, transparency image is created between them for better visualizations of geological events. Additionally, a cross-plot panel can also be created between 2 volumes, allowing to generate a geobody from a cluster of values associated with the geo-feature on the transparency image which can be defined by the users.
In the second step, using the Kora 3D seismic volume as an input for the full-volume, semi-automatic 3D seismic interpretation technique, all possible horizons in the seismic volume are auto-interpreted in one attempt as a result of the Model Grid creation process. Those surfaces/horizon patches are editable and polarity-consistent, either in peak, trough, zero-crossing, or inflection points. The volcano geobody will be included in the Model Grid as a hard constraint, where the horizon propagation will stop, avoid any possible misinterpretation in the chaotic, volcanic edifice zone (figure 2, 3)  (watch this tutorial for a more in-depth view of this process).
Figure 2: Summary of the PaleoScan™ workflow: (1) Kora 3D Seismic, offshore New Zealand, (2) Model Grid creation and Auto propagation in the Model Grid, note that there will be no grid distributed within the volcano geobody (3) The key horizon patches can be editable following the interpreter's ideas, (4) 3D Geomodel is the result of the Model Grid interpolation.
Figure 3: All horizon surfaces/patches are interpreted in one attempt thanks to the Model Grid creation process with Kora volcano geobody as a hard constraint.

From the 3D Geomodel, an unlimited number of chronostratigraphic surfaces or a Horizon Stack can be extracted, and mapped with various attributes, allowing the users to quickly scan the seismic volume to understand the geological evolution and lateral and vertical changes of depositional facies of the volcanic system (Figure 4).

Figure 4: Using color-blended Spectral Decomposition Horizon Stack to reveal the evolutionary history of the Kora volcanic system.

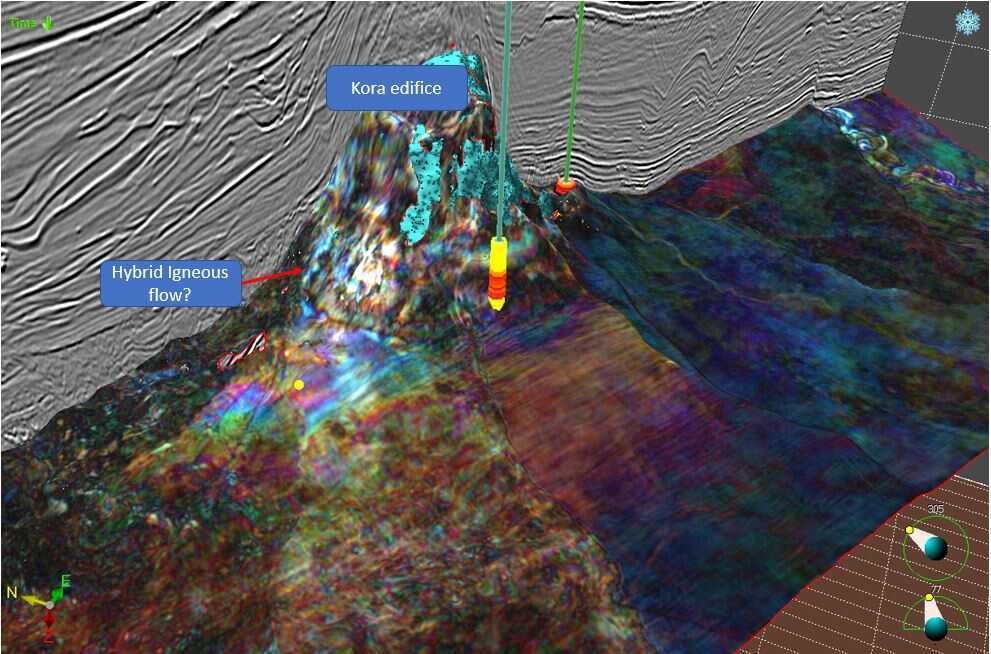
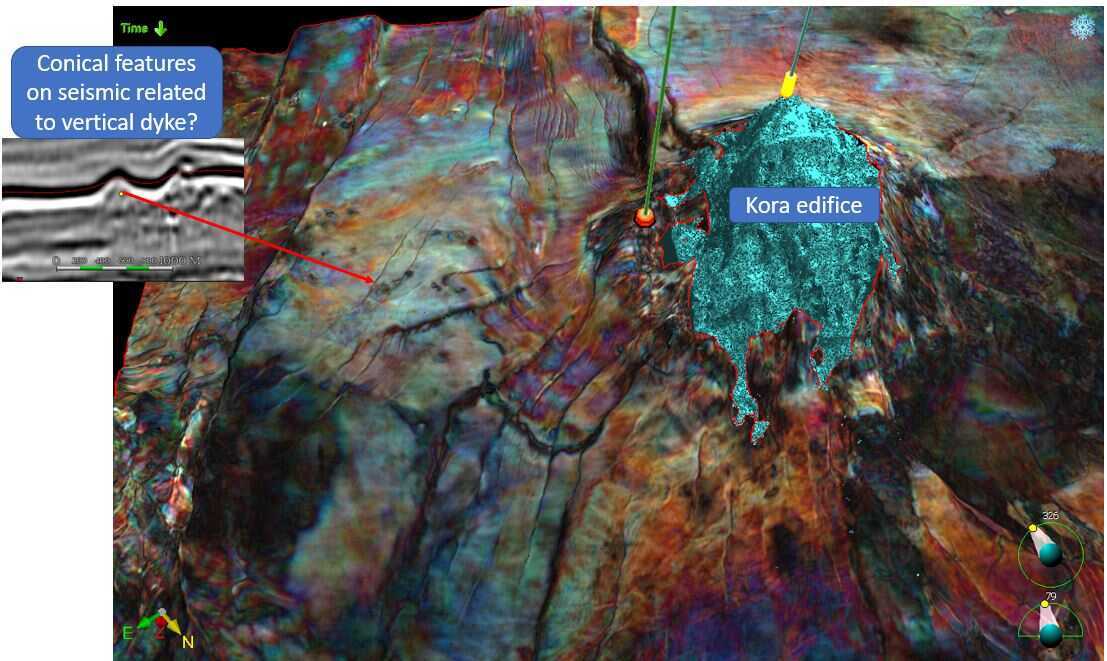
From the horizon stack, igneous features which are sometimes misinterpreted as sedimentary features such as hybrid igneous flow or conical features related to vertical dykes can be revealed robustly (figure 5). Those features can also be extracted as 3D geobodies for geological modelling purposes (see also PaleoScan™ Geobody Extraction).

Figure 5: Example of igneous bodies such as igneous flow (upper) and conical, vertical dyke related features (lower) that mimic the seismic facies of common sedimentary exploration targets were highlighted on color-blended, spectral decomposition horizon stack.

To find out more about the workflow or PaleoScan™ 2021, drop us a line at contact@eliis.fr or visit our website

Case study: Kora 3D, offshore New Zealand. The author would like to thank the Ministry of Business, Innovation, and Employment (MBIE), New Zealand, for the authorisation to publish the Kora 3D seismic data.

Drop us a line !

Stay connected !

Stay connected !