


PaleoScan™ Automated Fault Extraction Workflow: A case study from Chrysalids 3D, offshore Canning Basin, Australia
Structural interpretation plays a vital role in petroleum exploration and production workflow (e.g. seismic interpretation, geological modeling, well placement, etc.). Conventionally, this has been achieved by manually picking faults on seismic lines which are labor-intensive and time-consuming especially in complex geological areas. More recently, Machine Learning techniques have proposed a lot of advances but they still remain a considerable challenge due to the requirement of time and huge datasets to train the software.
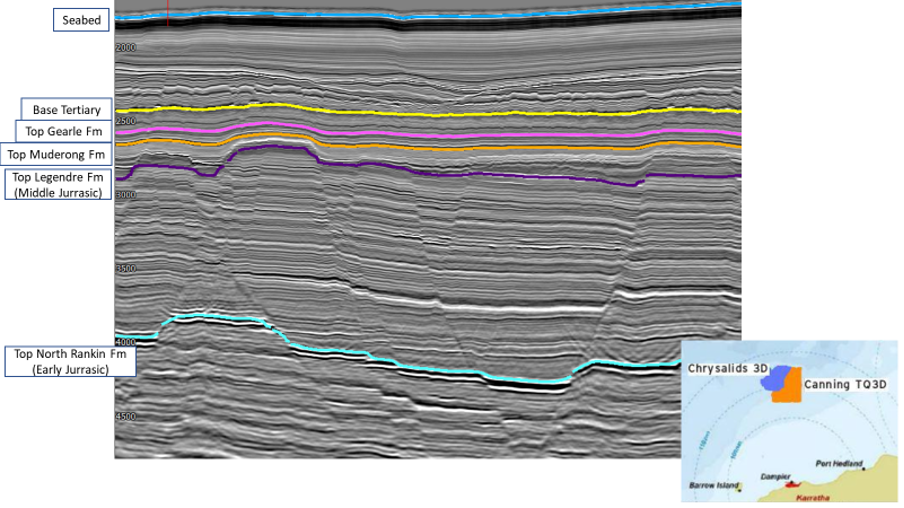
Hereby using PaleoScan™, we propose an innovative, data-driven workflow for detecting and extracting faults. The fault set comprised of 1400 faults was achieved from a cropped Chrysalids 3D seismic volume (10gb~ 700km2) (Figure 1) in a reasonable manner of time (45 mins to 1 hour for 1GB of seismic data). Hence, the time cycle for fault picking and PaleoScan™ Seismic Interpretation workflow was significantly reduced.
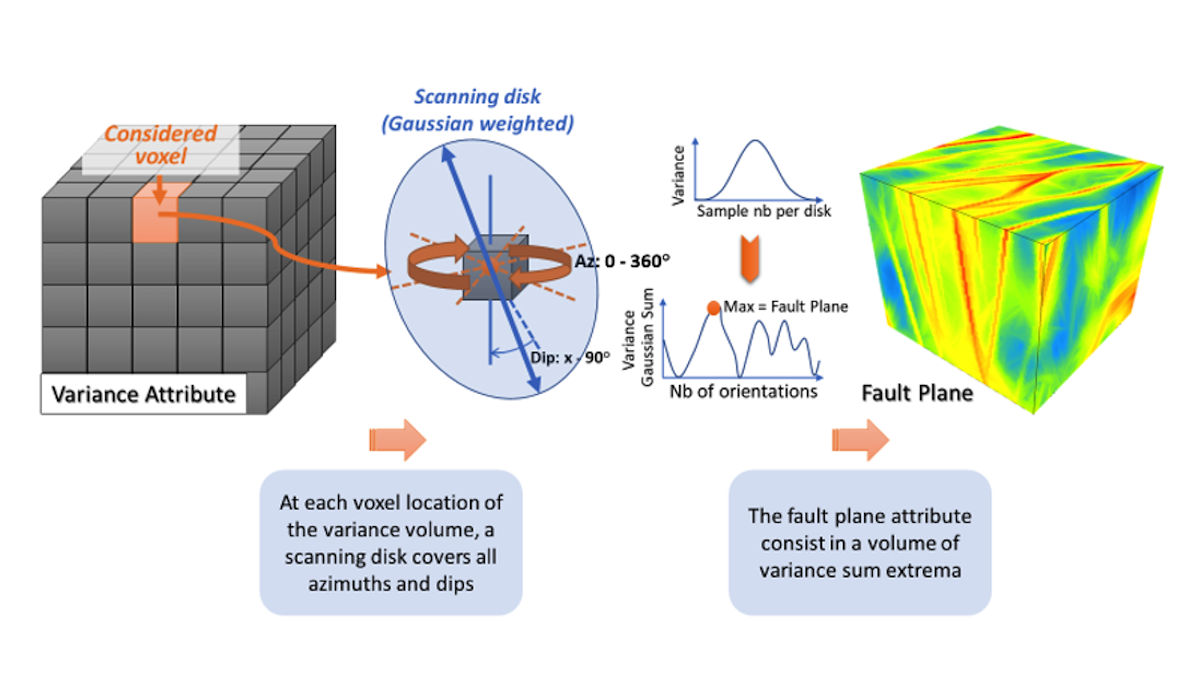
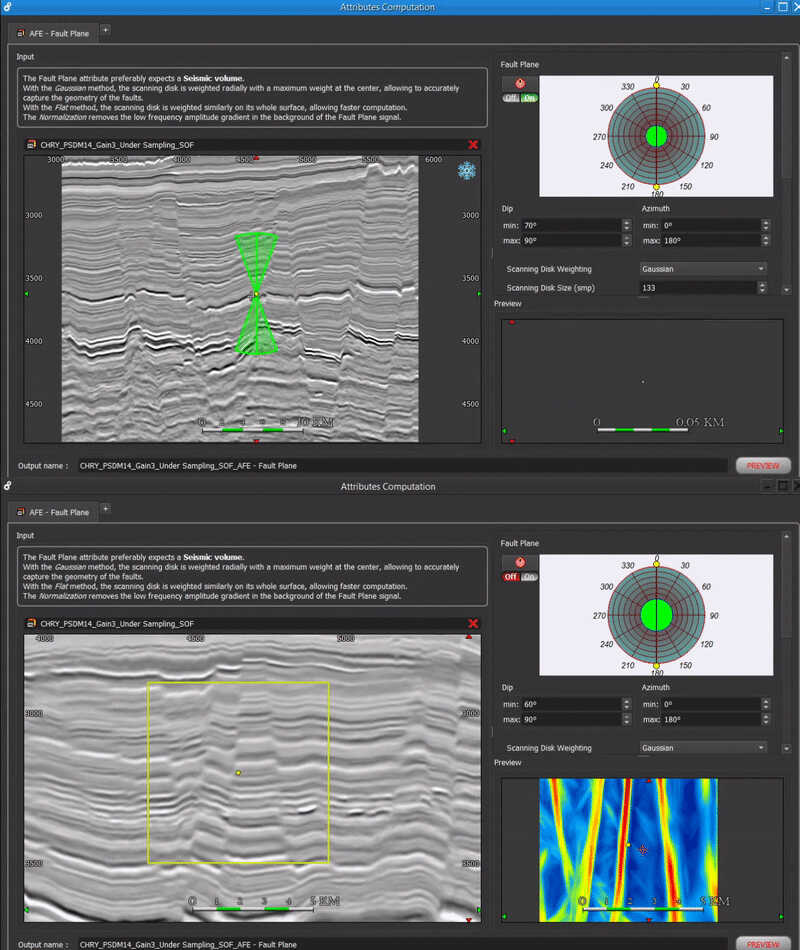
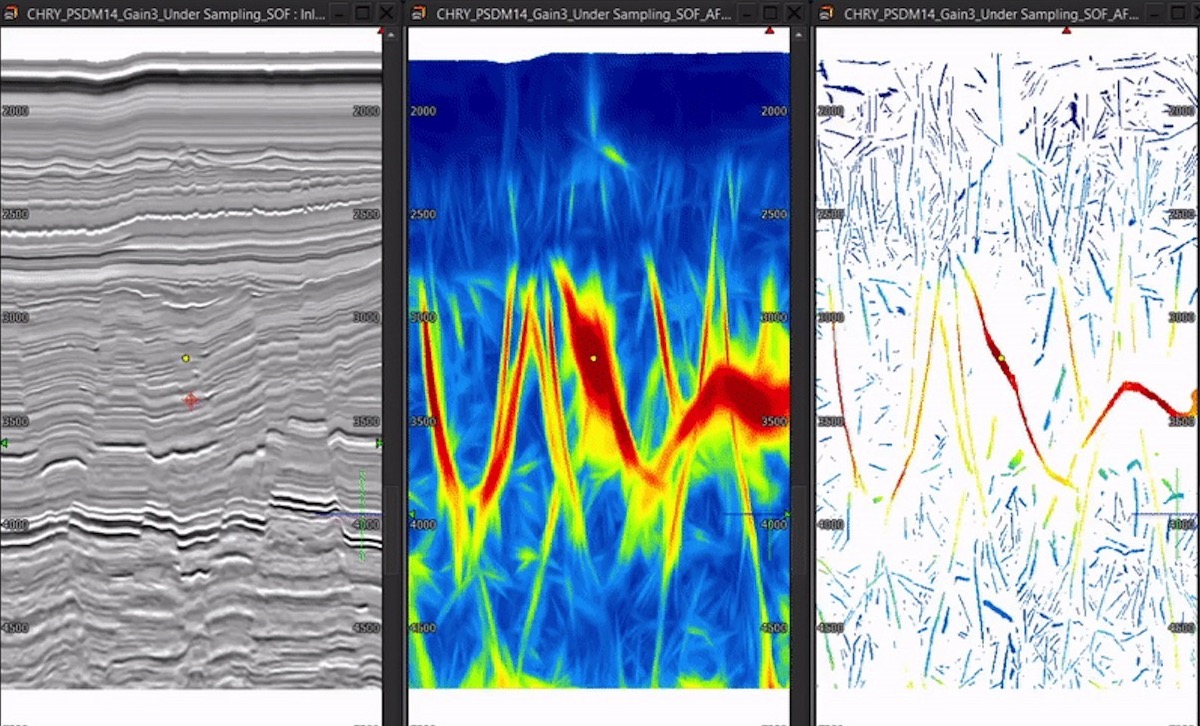
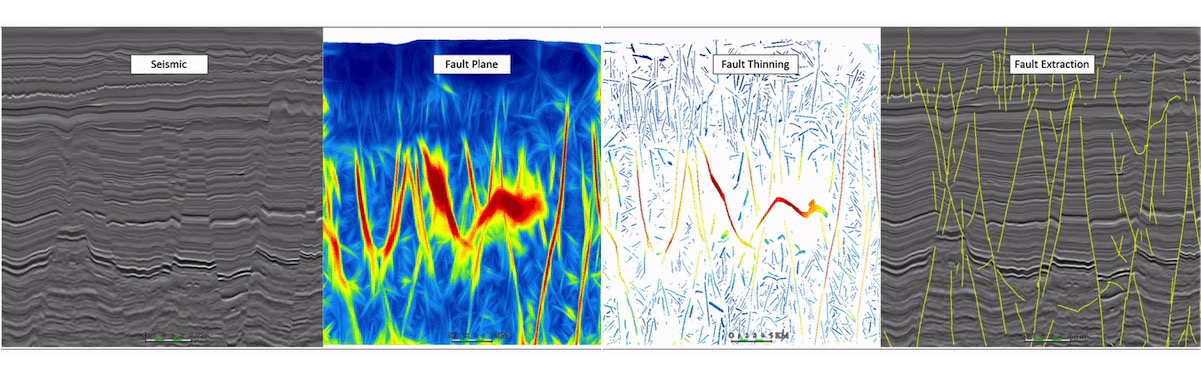
The workflow consists of three steps. In the first step, a new attribute called the Fault Plane attribute was generated from variance values of the seismic volume. An elongated disk was applied on each voxel of the seismic volume, scanning in every dip and azimuth ranges to compute the average maximum variance values in a specific direction, highlighting the probability and geometry of the fault network (Figures 2 & 3)
In the second step, the highest values of the Fault Plane Attribute were extracted along the highest gradient direction within a editable sampling window, to create Fault Thinning Attribute volume, allowing the users to visualize the skeletonized fault network.
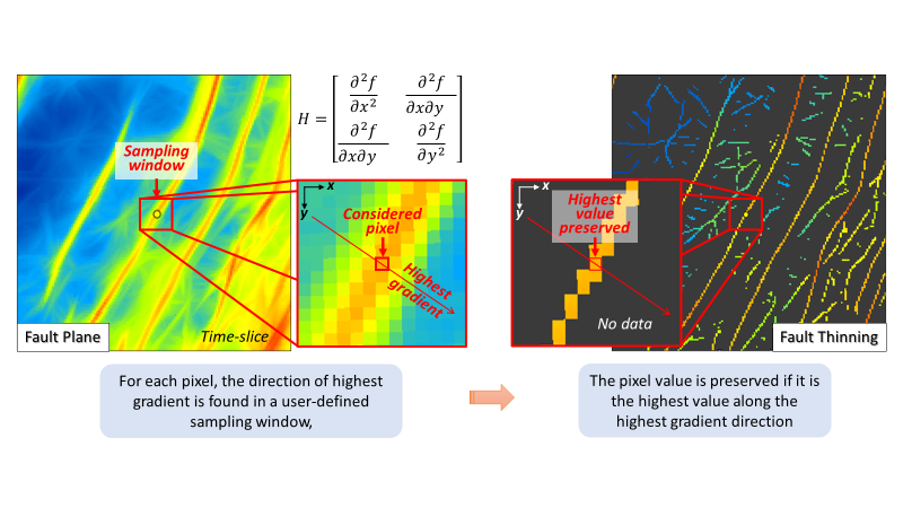
In the third step, fault planes were generated by linking those highest pixel values from the Fault Thinning attribute volume and saved as a single fault set. The user can modify parameters such as the minimum pixel values to be extracted, the minimum dimension in sample, and planarity of extracted faults in order to keep the most important ones.
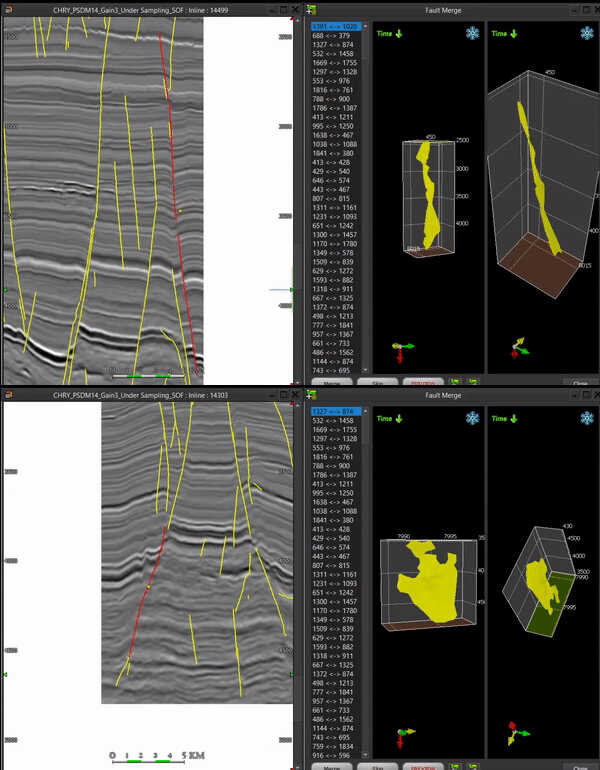
Once the fault set is generated, a stereonet is available, allowing the interpreters to filter the faults by their size, dip, and azimuth to have a more complete fault set and sort them in different categories e.g. local/regional, specific dip, and azimuth range.
-1200-9999.jpg)
In addition, PaleoScan also has a fault-merging assistant, to detect two fault planes which are most likely to be part of a single fault based on their distance, azimuth, and dip, then merge them together to have a brand new fault. These rapid hands-on solutions could help to filter efficiently the results of the automatic fault extraction workflow.
To find out more about the workflow or PaleoScan™ 2021, drop us a line at contact@eliis.fr
Case study: Chrysalids 3D, offshore Canning basin, Australia.