Icon décoration

PaleoScan™ 3D Relative Geological Time Model

PaleoScan™ 3D Relative Geological Time Model

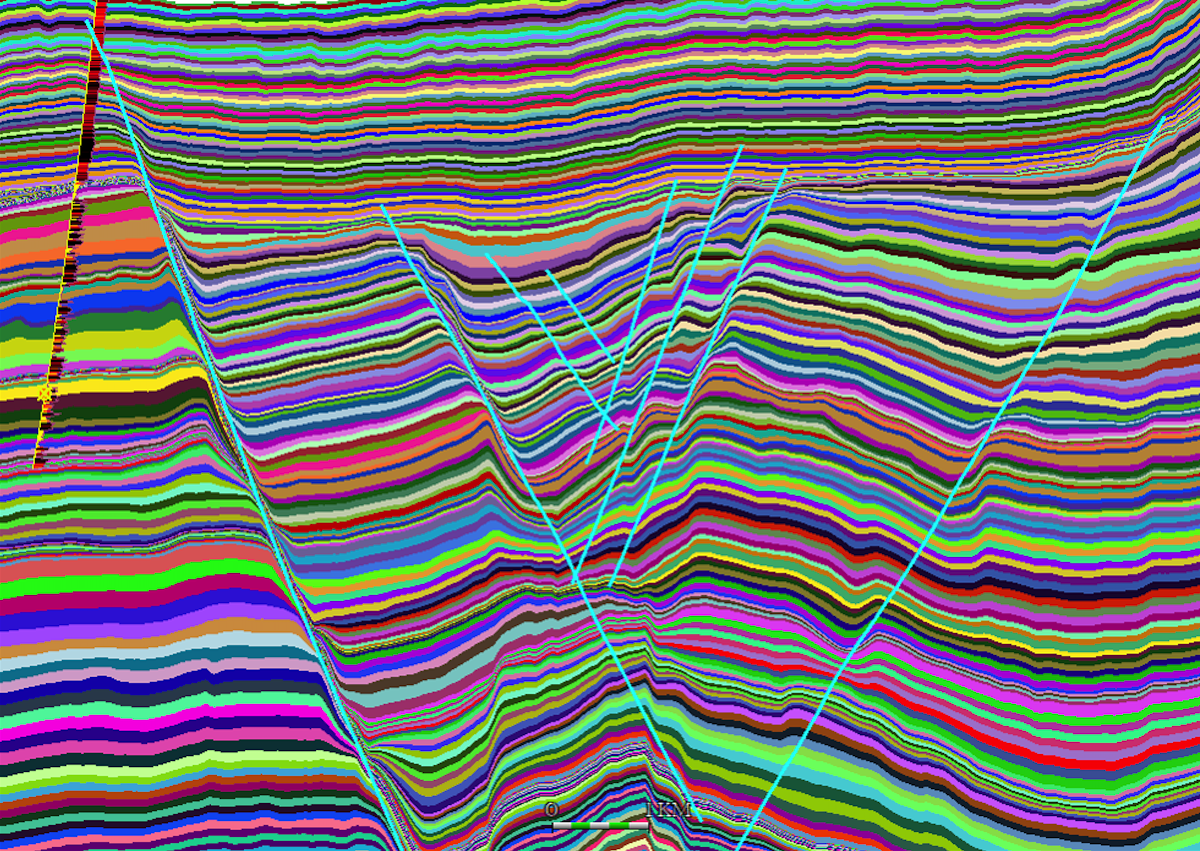
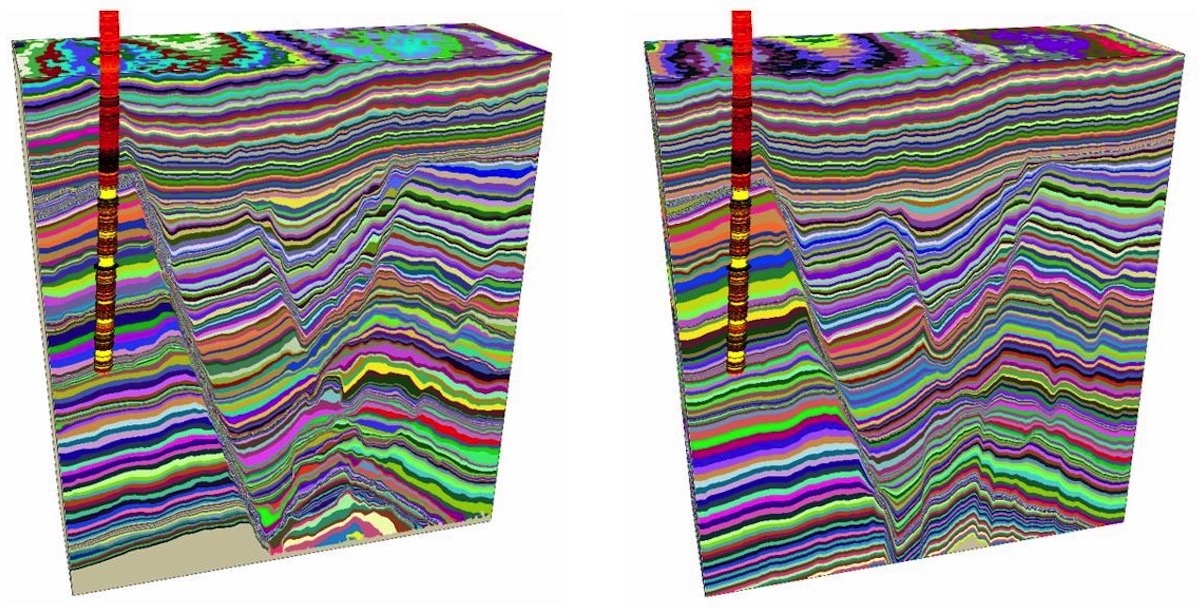
The 3D Relative Geological Time (RGT) model is an unique product from the PaleoScan™ Full-volume, semi-automated 3D seismic interpretation workflow. In the workflow, the software automatically auto-propagates all the horizons available in the 3D Seismic Volume via the 3D Model Grid and then interpolates them stratigraphically to build the 3D GeoModel. However, poor quality data zones (e.g noisy or low amplitude seismic interval) might reduce the quality of the interpretation some time (figure below).

Figure 1: Example from Draeck 3D, offshore North West Shelf, Western Australia,(Clio-1 exploration well shown). Left: the original seismic volume; Right: the 3D RGT model calculated from all the patches of the 3D Model Grid. Note that the Mungaroo formation at the lower section of the volume has some areas of poor-quality seismic signal, leading to some inconsistencies in its counterpart 3D RGT model.

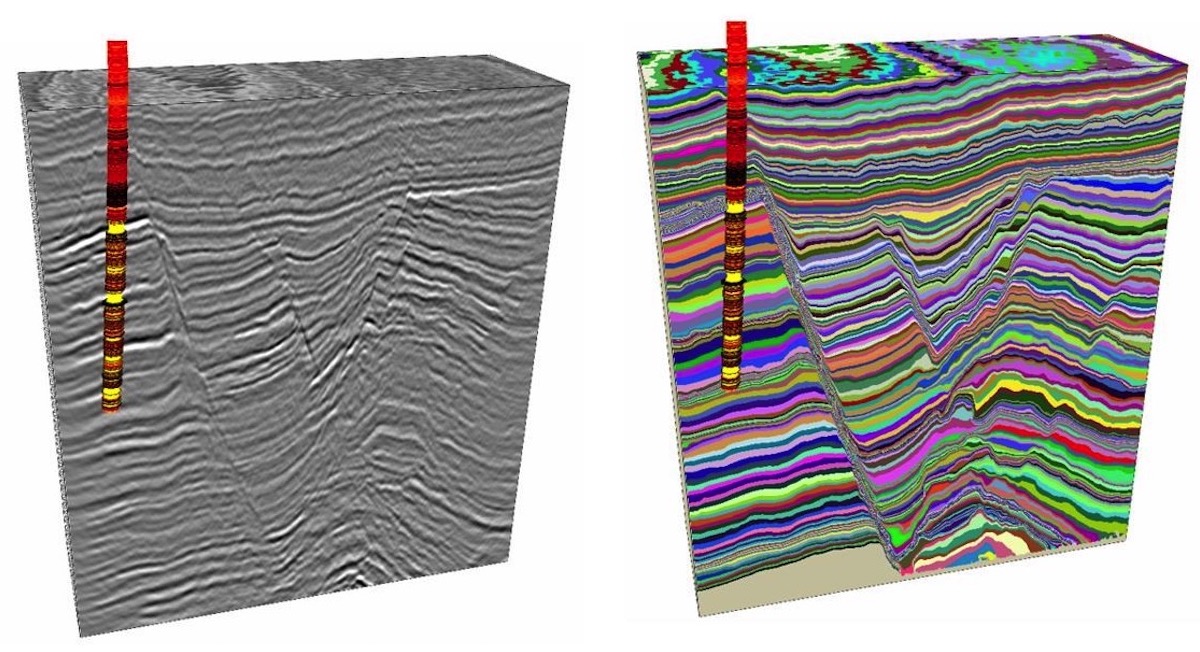
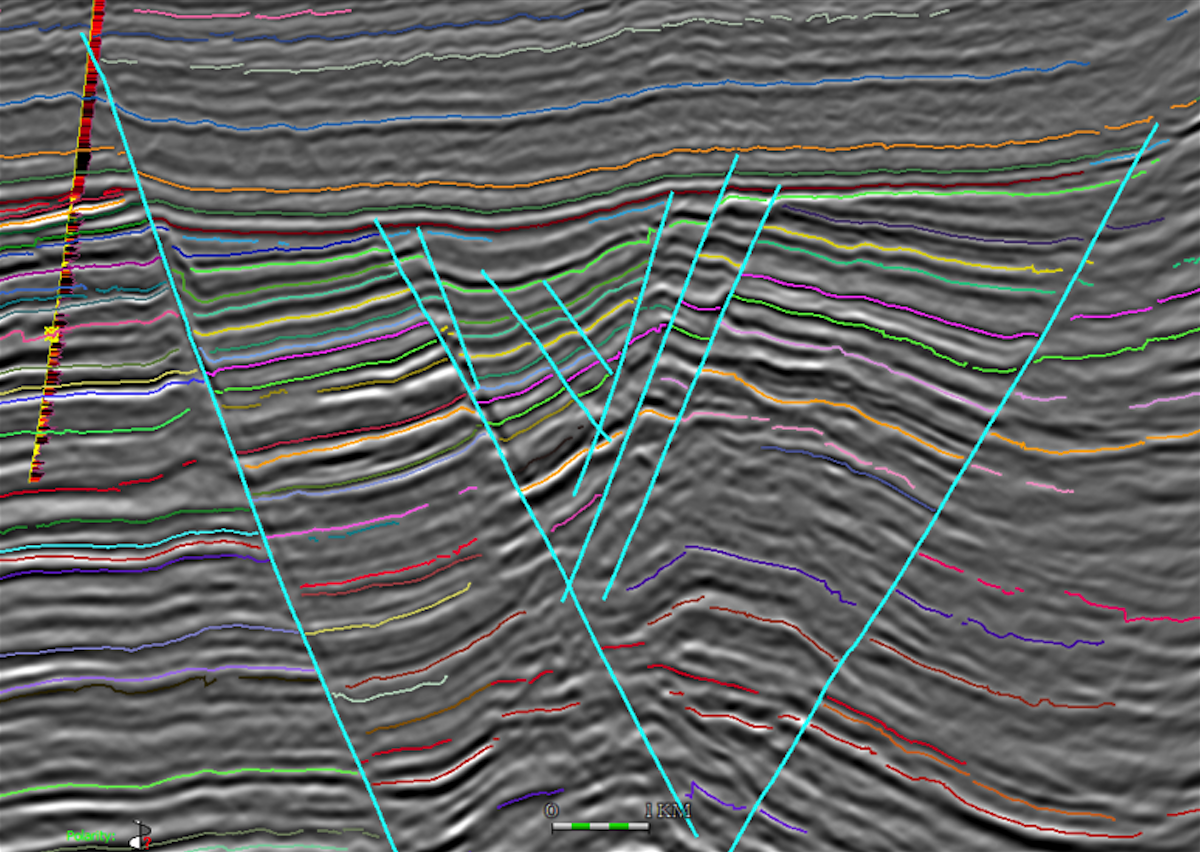
To overcome that challenge, we have an alternative way to build the 3D RGT model, which is based only on the most reliable reflectors - highlighted as marked horizons in the 3D Model Grid.

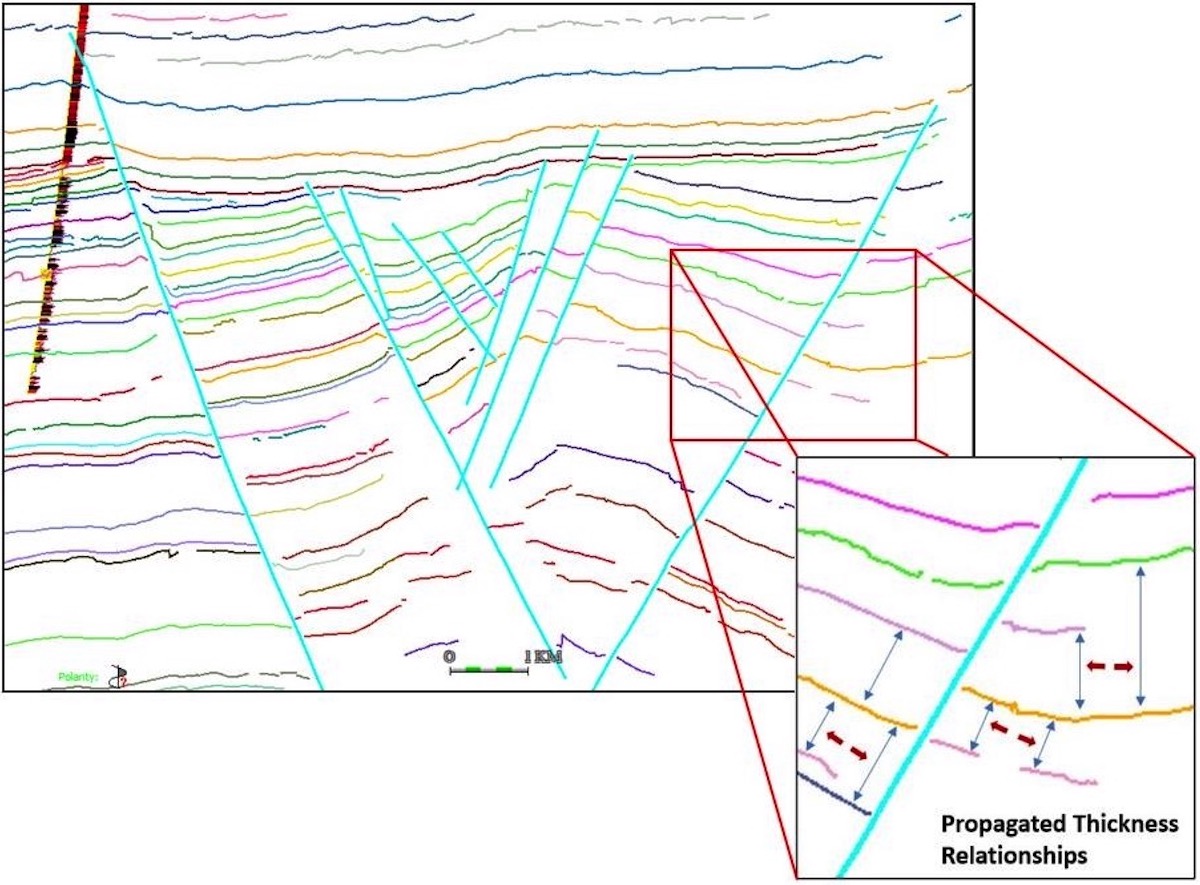
In other terms, the seismic signal at the background will be neglected and the software only interpolates these marked horizons and then iso-proportionally divides the intervals between them (Figure 2). Hence, the interpreters will have better control over the geometry of the 3D RGT model. 

Figure 2: Workflow showing an RGT model calculated from
Figure 2: Workflow showing an RGT model calculated from "marked" horizons only. These horizons defined by the interpreter were then propagated following the thickness relationships between them.
Figure 3: Comparison between the 3D RGT model from all the patches of the 3D Model Grid (left) and 3D RGT model from marked horizons of the 3D Model Grid only (right). The consistency of the lower section was significantly improved in the right hand sidemodel.

Case study: Draeck 3D, offshore North West Shelf, Western Australia.

To find out more about the 3D Relative Geological Time Model, click here or drop us a line at contact@eliis.fr.

EvènementsShare on social media

Drop us a line !

Stay connected !

Stay connected !