


PaleoScan™ 2025.1 - Out Now!
A Step Change to Transform Seismic Data into Reservoir Insight
Eliis’s 2025 software releases have provided the largest update to PaleoScan™ to date. A mix of new features in seismic interpretation—such as GeoBlend and new 2D/3D trackers—along with additional functionalities that further bridge the gap between seismic interpretation, petroleum system and reservoir modelling. Coupled with quality-of-life improvements such as better multi-screen management, this new release will empower geologists and geophysicists to make the most of their investments in seismic and wellbore data.
One of the key features of 2025.1 is Prospect Evaluation, where geoscientists can now identify traps for hydrocarbons or CO2, compute volumes, define injection points and visualise fill-spill and leakage points. Leveraging the horizon stack as well as petrophysical properties, Prospect Evaluation is a welcome interactive mapping contribution to petroleum system modelling.
Released on time and above spec, PaleoScan™ 2025.1 is the highlight of our recent development cycles—delivering the rapid, reliable innovation that has made PaleoScan™ a global standard in subsurface workflows for hydrocarbon and low-carbon energy exploration, as well as CCS and shallow soil characterization for offshore wind farm developers.
PaleoScan™ 2025 New Feature Highlights
Interpretation
- GeoBlend
- Metadata
- 2D & 3D Tracker Improvement
- Gridding Enhancement
- Automatic AVO Crossplotting
Deep Learning
- AI GeoSeg
- AI FaultAsssit
Petroleum System Modelling
- Prospect Evaluation
Time/Depth
- 4D Attributes
- Depth-Depth Adjustments
2D Seismic
- 2D Line Mistie Correction
Data Management
- VDS Cloud
- OSDU Wells
Interpretation
Horizon Picking & Gridding
Manual interpretation remains a key step in geophysical workflows, whether for rapid regional mapping or for fine-tuning the results of the horizon stack.
In PaleoScan™ 2025, 2D and 3D multi-seed trackers feature enhanced control, improved guidance using an optimal path algorithm, and better gridding through a new convergence gridding method.
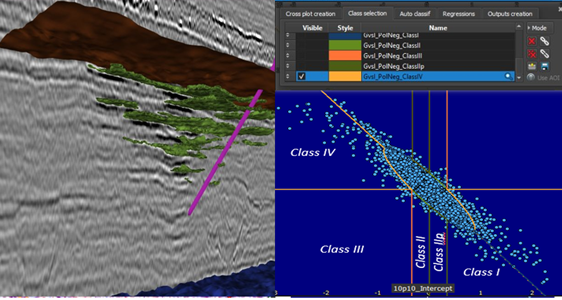
Automatic AVO Crossplotting
In the Quantitative Interpretation module, it is now possible to automatically generate cross-plots of the AVO classes defined by Intercept and Gradient volumes. Classes can then be exported as volumes or geobodies.
Petroleum System Modelling in PaleoScan™
For Hydrocarbon or CO2 Migration & Storage
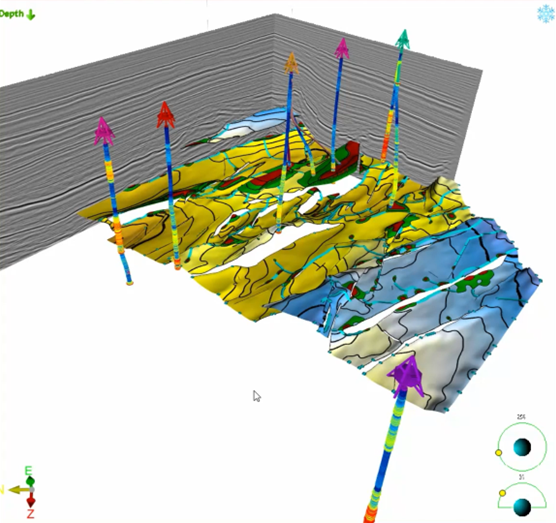
With the 2025 release of PaleoScan™, Eliis enters the Petroleum System Modelling space, bringing interactivity and ease of use to geoscientists.
By leveraging the horizon stack and petrophysical data, geoscientists can now quickly evaluate traps, estimate volumes, define injection point strategies, assess fluid migration impacts (based on injection points), and rank prospects.
Simple yet powerful, the Prospect Evaluation and CCS toolboxes will shorten the time-to-decision for acreage access and the overall portfolio strategy.
Deep Learning in PaleoScan™
Interactively Extract Complex Geobodies with AI GeoSeg 2.0
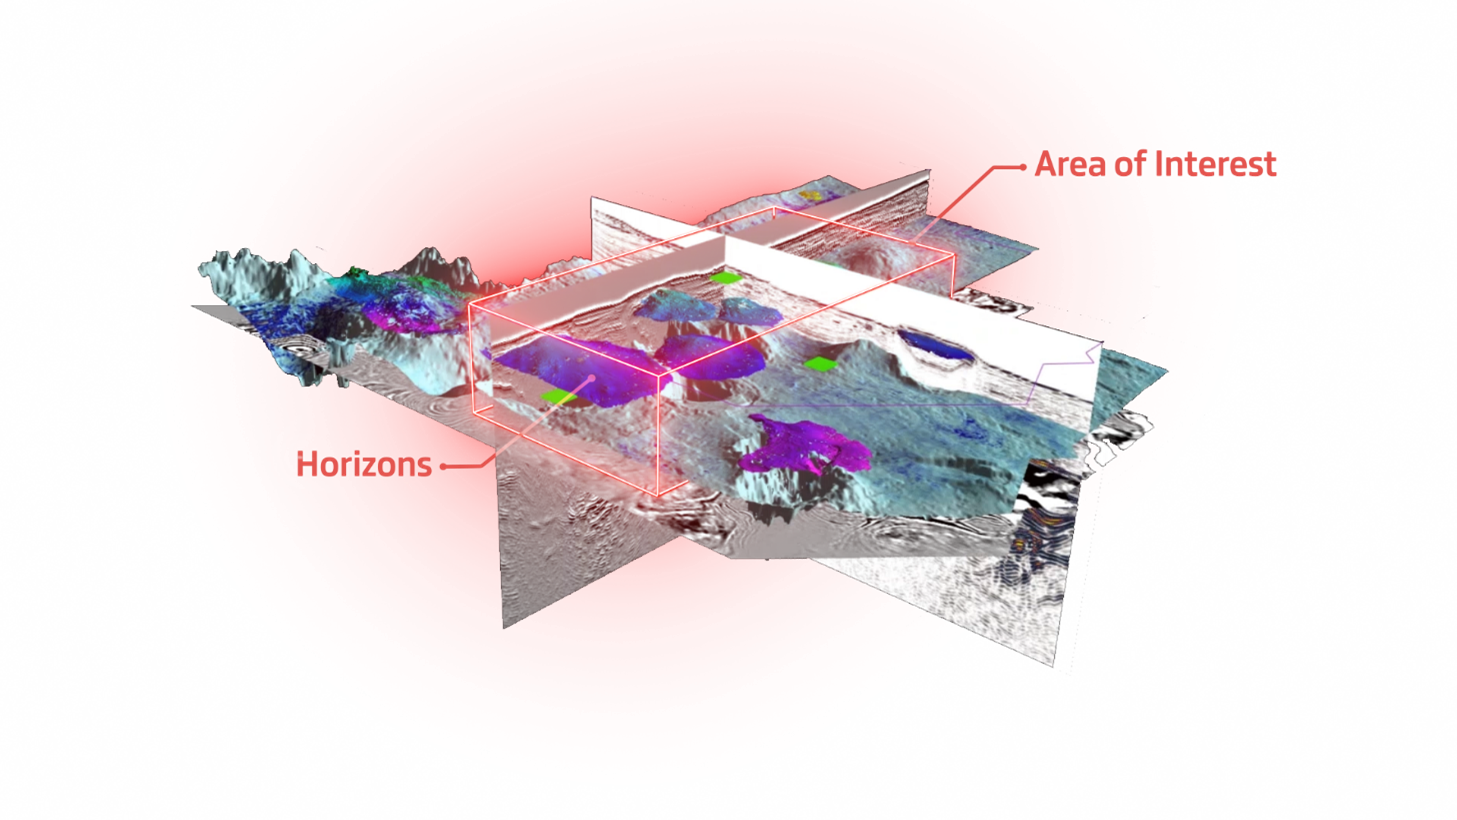
AI GeoSeg leverages the latest image segmentation algorithms to help geoscientists map complex gebodies and apply expert knowledge to guide the AI prediction.
This latest upgrade, AI GeoSeg 2.0, can be used in both the seismic and horizon-slice domains and can leverage any attribute available in PaleoScan™. Constraints on the prediction—such as Area Of Interest or top/base regional horizons—can be applied to improve the quality of the resulting probability volume.
Enhance Volume-Wide Structural Analysis with the Latest Updates of AI FaultAssist
Unveiled in 2024, PaleoScan™ AI FaultAssist—developed in collaboration with Chevron Technical Center—brings a new level of speed and precision to fault detection and extraction. Now in its 3.0 version, AI FaultAssist delivers fault likelihood predictions at every voxel, giving users more control through resampling, cropping, and preview options. It also features improved cleanup of edge effects and false predictions near dead traces, ensuring a cleaner, more reliable output.
AI FaultAssist can be deployed on-prem and in Azure cloud.
Time/Depth
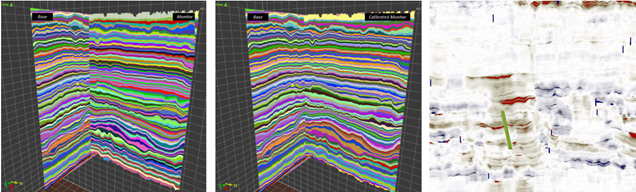
Characterize Baseline-Monitor Variability with 4D Attributes
Maturing oil fields and CO2 injection projects have supported the spectacular growth of 4D monitoring.
In PaleoScan™ users now have the ability to generate 4D attribute volumes to characterize time/depth/amplitude shifts between baseline and monitor surveys and visualize them as volumes or geobodies.
Streamlining Data Management with Native VDS
VDS eliminates the
need to create additional volumes to optimize performance in IL/XL/Z-slide
domain which saves space and is a new step in our OSDU™ roadmap.
PaleoScan™ now has native
support of the Volume Data Store (VDS) format, eliminating the need of external
transcoders and ensuring interoperability. VDS files can be stored uncompressed
but can also leverage adaptive compression in Lossless, virtually lossless and
lossy tolerances. The PaleoScan™ workflows run natively on VDS and do not
require temporary copies.
Horizon Quality Metadata and OSDU™-Based Well Log Classification
A new quality metadata generation tool enables users to efficiently assess and ensure the quality of horizons. The tool provides information related to the uncertainty of the horizon picks based on amplitude and frequency, displayed in the updated Metadata Info Tab.
On the wellbore side, we have now adopted the OSDU™ classification for log family and Main family categorization ensuring interoperability with other solutions. Markers have now richer attributes and geoscientists can assign log data directly to markers. In addition, advanced filtering is now available with improved visualization.
2D Seismic
Improvements in Conditioning and Mistie Correction for 2D Data
2D seismic data remains critical for New Venture teams, site investigation projects or geothermal data acquisition in populated areas.
PaleoScan™ now enables users to correct misties such as vertical shifts, phase rotations or amplitude balancing after choosing the reference line. This upgrade streamlines 2D Model-Grid creation especially when dealing with datasets of different vintages.
2D line names are now displayed in map-view.
Other New Features
For a comprehensive list of new features and enhancements, see the Release Notes in the Download Centre (accessible through your account).
To discuss the latest release with us in more detail, please contact us on sales@eliis.fr or reach out directly to you account manager.
For software
support, please contact support@eliis.fr