3D Wheeler Diagrams from your Seismic Cube with PaleoScan™
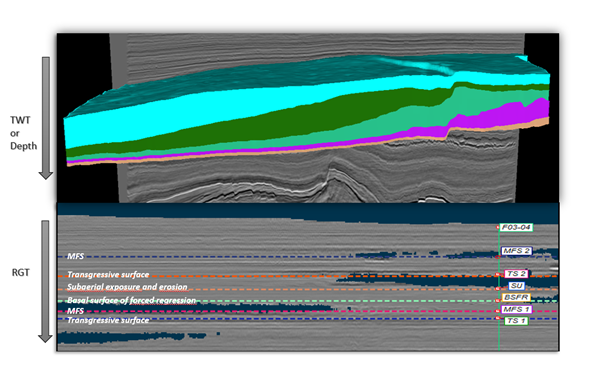
Wheeler diagrams have always been strategic tools to any basin's depositional history analysis. Within the technological evolution that the interpretation software packages, coupling this type of approach with regular analysis can significantly improve the interpreter’s workflow.
Based on the Relative Geological Time Model (RGTM - obtained from global seismic interpretation) used as a reference framework, PaleoScan™ flattens all the isochrones of the seismic volume to convert it into an interactive Wheeler domain. The Wheeler domain is “relative” as it is not possible to recreate an interval of non-deposition if the interval is missing on the whole seismic volume (e.g. hiatus with parallel unconformity). The Wheeler diagram tool helps improving the delimitation of sequence boundaries and expanding the understanding of the seismic cube.
To access this feature within PaleoScan™, the user must initially activate the extension "Advanced Interpretation".
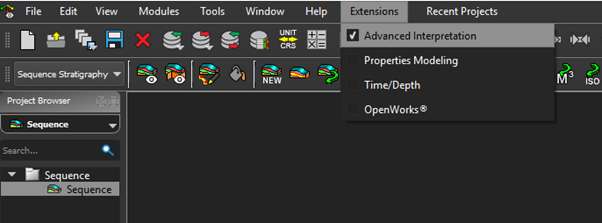
From the "Sequence Stratigraphy" module, select "New Strati Viewer". The user must first select a reference Geomodel for the flattening. Then, the initial seismic cube has to be selected for the visualization of the flattening.
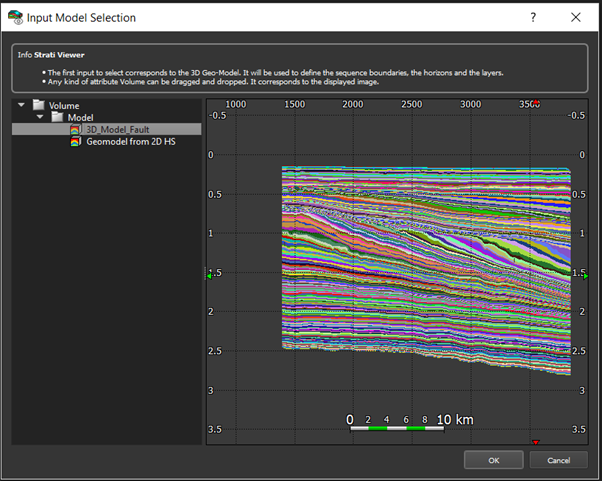
Once the two volumes are selected, press "T" to swiftly switch to the Wheeler domain and move to the interpretation!
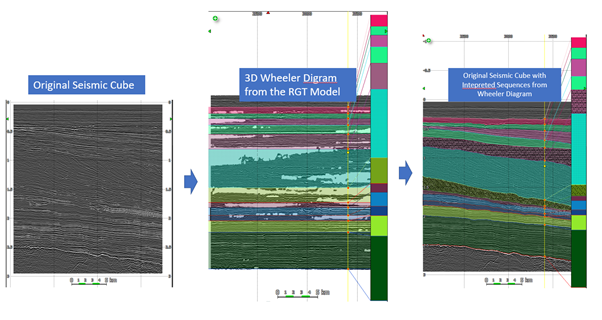
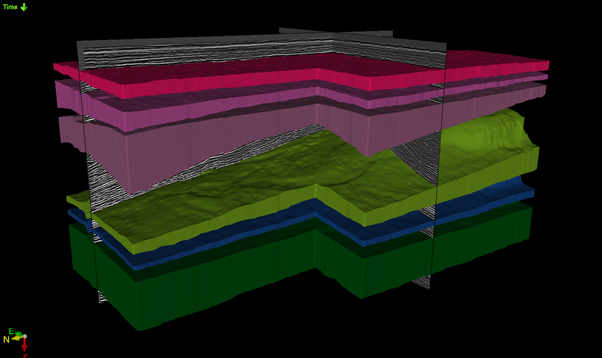
The Wheeler diagram tool offers the user a range of options to perform the sequence analysis (e.g; marking depositional events as Maximum Flood Surfaces, Transgression zones) ranging from the picking of layer/system trac boundaries to the volumetric and isochoric calculation of these layers. Each of these output can be displayed in 3D alongside with the seismic cube. The user can also assign a name and a lithologic pattern to each layer of a sequence and display these characteristics as a Strati Column in a 2D viewer.
For more information, and specific support, contact support@eliis.fr

