Icon décoration

PaleoScan™ Stratigraphic Interpretation Workflow for 3D Seismic Data in the Deltaic-Marginal Marine Environments

PaleoScan™ Stratigraphic Interpretation Workflow for 3D Seismic Data in the Deltaic-Marginal Marine Environments

It is estimated that over 15% of the total reserve of siliciclastic hydrocarbon reservoirs is located in slope and basin floor areas. However, the lack of tools and the variability of the seismic data quality are causing troubles to evaluate the sand accumulation and visualize both laterally and stratigraphically the evolution of the depositional system in those areas.

On seismic data, marginal-deltaic systems are often recognized as a stack of two-dimensional surfaces with sigmoidal (sloped) geometry of clinoforms. In conventional techniques, clinoforms will be interpreted one-by-one manually which is extremely time-consuming and challenging as clinoforms are often deposited locally and periodically due to the differential compaction and sediment influx/loading.

Hereby using PaleoScan™ software, we propose an innovative workflow to extract stratigraphic insights from the seismic data and identify detailed geomorphic elements in shallow marine, marginal-deltaic environments. Thanks to the PaleoScan Full-volume, semi-automatic 3D seismic interpretation technique, all clinoform surfaces are interpreted in one attempt as a result of the Model Grid creation process (Figure 1).

Figure 1: All clinoform surfaces/patches are interpreted in one attempt thanks to the Model Grid creation process. An example from Maui 3D, New Zealand.

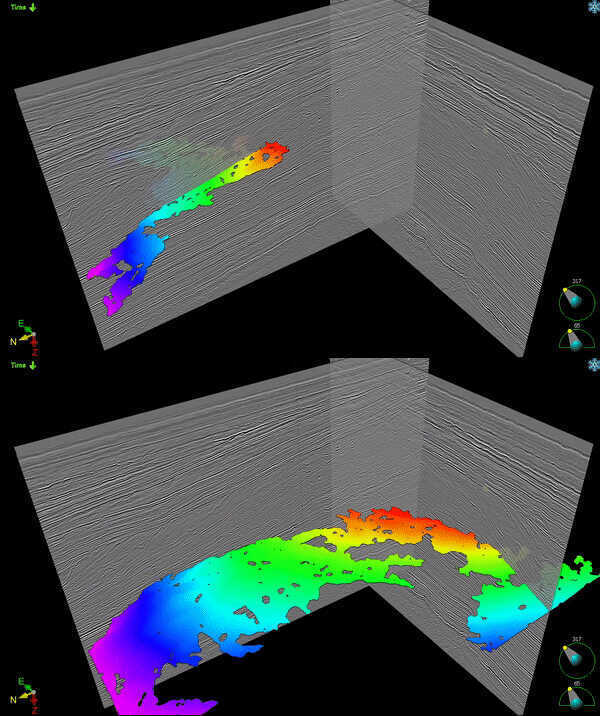
Those horizon patches in Model Grid are editable and polarity-consistent, either in peak, trough, zero-crossing, or inflection points, acting as a chronostratigraphic framework for the 3D Relative Geologic Time model (or 3D Geomodel) which is the interpolation of the Model Grid (Figure 2).

Figure 2: Summary of the PaleoScan™ workflow: (1) F03 3D Seismic, offshore Netherland, (2) Model Grid creation, (3) Auto propagation in the Model Grid, (4) The key horizon patches can be editable following the interpreter's ideas, (5) 3D Geomodel is the result of the Model Grid interpolation.
From the 3D Geomodel, an unlimited number of chronostratigraphic surfaces or a Horizon Stack can be extracted, and mapped with various attributes, allowing the users to quickly scan the seismic volume both laterally and stratigraphically to understand the geological evolution of the system (Figure 3).
Figure 3: Using the PaleoScan™ Color Blending tool, spectral decomposition attribute with different frequencies horizon stack can show highly-detailed geomorphological elements of the clinoform system. An example from Maui 3D, New Zealand.
Also, from the 3D Geomodel, the users can build a stratigraphic framework or convert the seismic volume into an interactive Wheeler Diagram using the PaleoScan™ Sequence Stratigraphy module (Figures 4 and 5). This will allow picking the layer between two clinoform surfaces (clinothem) interactively in 3D, taking into account the vertical and lateral changes of the thickness of each clinothem (Figures 4 and 5).
Figure 4: Thanks to the 3D Geomodel, all horizons in the 3D seismic volume are flattened by using Wheeler diagram transformation in the PaleoScan™ Sequence Stratigraphy module. Clinothems are defined in 3D interactively. An example from Maui 3D, New Zealand.
Figure 5: (Maui 3D) clinothem geobody with isopach maps overlaid are displayed in 3D, showing the sediment thickness changes in each clinothem, both laterally and vertically.

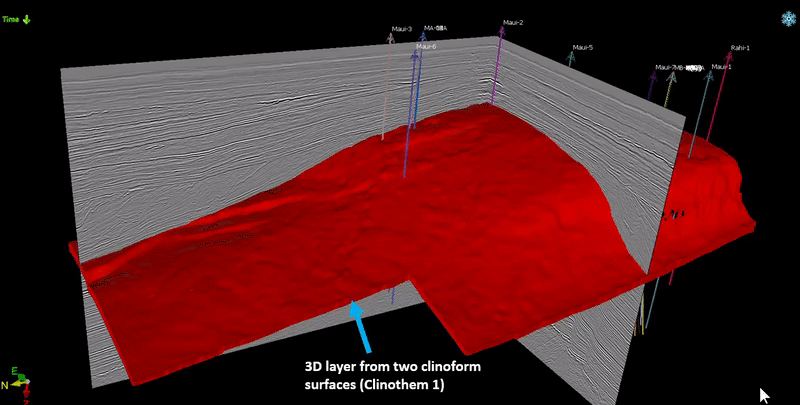
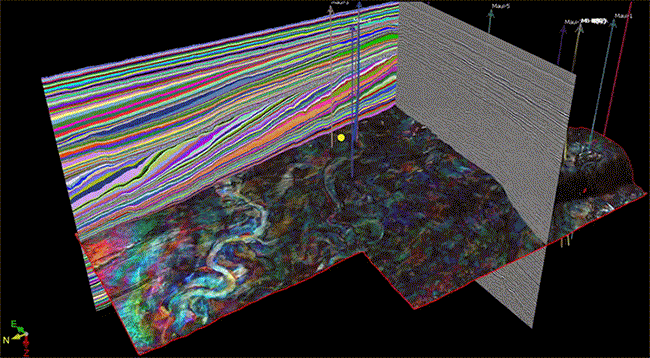
Case study: F03, offshore Netherlands. Maui 3D, offshore New Zealand. 

EvènementsShare on social media

Drop us a line !

Stay connected !

Stay connected !