


PaleoScan™ Blending Viewers
The Blending Viewers is a special function in PaleoScan which allows the interpreters to blend and visualize simultaneously two or three objects with different types of data in both 2D and 3D domains. The Blending Viewer has two or three channels. The input for the Blending Viewers channels can vary from 3D volumes, 3D Horizon Stack to 3D single horizons, and 2D seismic lines (Fig. 1)
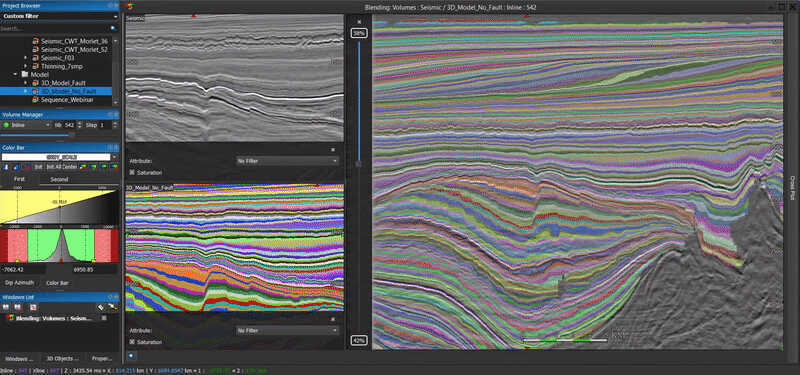
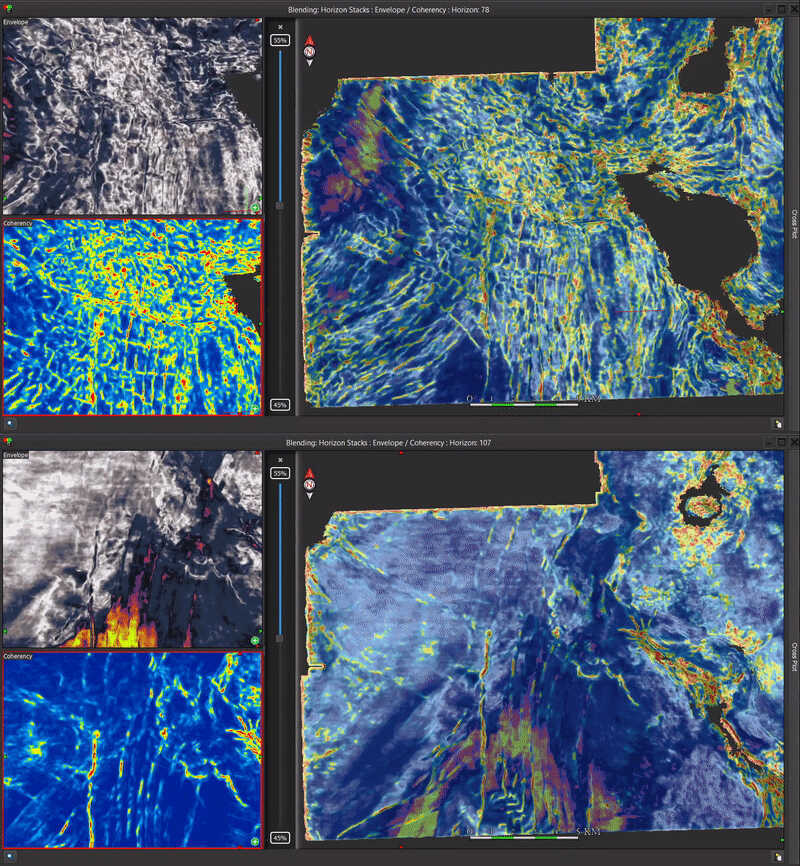
The displayed data in each channel can be seismic attributes, Z values, values from velocity models, or inversion cubes. Thus, this feature can be very powerful when it comes to QC the 3D Relative Geologic Time model (Fig. 1) or visualize the Horizon Stack with different seismic attributes blended for better prospect delineation (Fig. 2, 3).
Also, the Cross-plot tool is integrated into the Blending Viewer in order to visualize the value points from each channel and extract them as geobodies (see PaleoScan™ Geobody Extraction ).
To find out more about the Blending Viewers feature or PaleoScan™ 2021, drop us a line at contact@eliis.fr
Case study: F03 3D, offshore Netherlands.